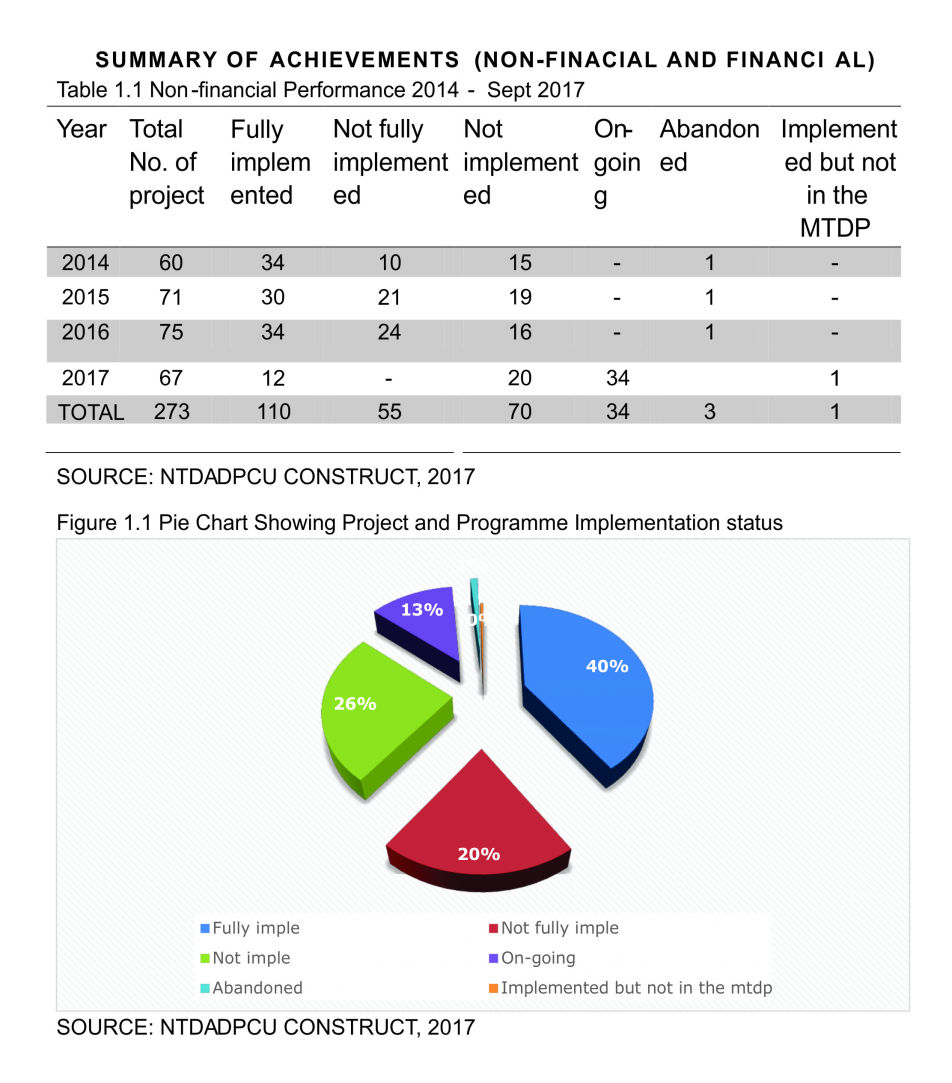
A review of the performance of the North Tongu District in the implementation of 2014-2017 MTDP is critical to provide the basis for informed decision making. An assessment of the performance of the District in the past four years took the form of monitoring the achievements with the set targets in all sectors. However, the review of the performance of District for the just ended plan period has shown an improvement in the provision of education infrastructure and water and sanitation facilities. Little progress was made in the areas economic and spatial development. Also, some interventions were made in the area of agriculture with some programmes implemented during the plan period. This has clearly manifested in the overall performance of the District as private sector played an insignificant role in the District’s development Agenda.
Show the performance of the non-financial projects of North Tongu District Assembly during the period of 2014-2017. During the period between 2014 and 2017, records show that 40% representing 110 out of 273 of the non-financial projects were fully implemented with 26% representing 70 out of the 273 not implemented. Although 40% of the non-financial projects were fully implemented, 20% of them representing 55 out of the 273 were implemented but not fully. In relations to on-going projects, the district has 13% of the non-financial projects still going on with 1% representing 3 projects abounded due to some unforeseen happenings. Finally the district also wants to establish that a projects was also implemented within the four years period which are not captured in the MTDP. The non-financial summary table above also represents the number of projects implemented fully, not fully implemented, on-going, abounded and implemented but not planned for an annual basis. See ANNEX A for the comprehensive table of the non-financial projects.
The topography of the North Tongu District is gentle, ranging from near sea level to about 18 meters (60 feet) above sea level, with slopes less than 5 per cent. The areas near the Volta River are at a higher elevation, falling gradually backwards. .
Temperature and relative humidity vary little throughout the year. The mean temperature is 27º C and the maximum and minimum vary from 22º C to 33º C. respectively. . .
The people of the North Tongu District are mainly Ewe speaking people organized under traditional authorities.
The main water body watering the North Tongu District is the Volta River. The District is also drained by the Alabo, Kolo, Aklakpa, Gblor, Bla (Bla-Battor), Anyorgborti (Aveyime) and Nyifla streams and their numerous tributaries into the Volta River, which runs North – South through the District.
There are various festivals celebrated by the various traditional authorities in the area, which serves as a unifying instrument to mobilize resources for development.
| SN | TRADITIONAL AREA | FESTIVAL | MONTH OF THE YEAR |
|---|---|---|---|
| 1 | Bator | Hogbeza | December |
| 2 | Dussor | Ayimagonu | November |
| 4 | Mepe | Afenorto | August |
| 4 | Volo | Tugbedzo | September |
SETTLEMENT SYSTEM
Human settlement in the North Tongu District is uncontrolled thus posing serious challenges to proper town planning. Majority of the developers seem to be unaware of the essence of following building rules and regulation thus sticking to their own ways of land development. The situation if not controlled may pose serious challenges to spatial development thus having subsequent consequence on the overall development of the District. Majority of settlements are linked up with untarred roads and foot paths. Figure 1.8 shows the District maps depicting the various communities.
FUNCTIONAL HIERARCHY OF SETTLEMENTS
Juapong remains the largest community in the District with the highest forms of functions mainly as a result of its location along the main Accra-Ho road. Battor, Mepe, Aveyime are increasingly becoming urbanized due to their proximity to the national capital city Accra. Table below presents the scalogram depicting the spread of development across the top thirty (30) communities in the District. Also included is the hierarchy of settlements in the District.
SURFACE ACCESSIBILITY
Majority of the roads in the North Tongu District are untarred and highly unmotorable making accessibility to some areas difficult. Due to the nature of the land, graded roads do not take a lot of time before going bad again. The only tarred road in the District is the Mepe - Sege road. This has made the movement of goods and services from the hinterlands to the major market centres difficult. The poor road network is discouraging investment in the District as some investors are scared off by the nature of the roads which hampers the transportation of materials and finished products. The Adidome – Volo – Juapong and Aveyime-Juapong feeder roads, which has been constructed, has form a major outlet for the District and is expected to greatly improve surface accessibility in the District. The figures below show the various road networks in the North Tongu District.
WATER TRANSPORTATION
Water transportation is also one of the means of transport used in the North Tongu District. It provides the easiest and shortest access to other parts of the district as the Volta River virtually divides the district into two. It is therefore imperative to develop the system of water transportation in the District in order to make it safer for the users as outboard motors are used for the transportation. The figure 1.11 below shows a view of transportation on the Volta River.
Figure 1.11 Water Transportation
| Activity status |
Total
Number | Percent |
Male
Number | Percent |
Female
Number | Percent |
|---|---|---|---|---|---|---|
| Total | 64,804 | 100.0 | 29,717 | 100.0 | 35,087 | 100.0 |
| Economically active | 42,965 | 66.3 | 19,346 | 65.1 | 23,578 | 67.2 |
| Employed | 41,161 | 95.8 | 18,495 | 95.6 | 22,611 | 95.9 |
| Worked Did not work but had job to | 38,526 | 93.6 | 17,404 | 94.1 | 21,073 | 93.2 |
| Go Back to Did voluntary work without | 2,511 | 6.1 | 1,036 | 5.6 | 1,470 | 6.5 |
| Pay | 124 | 0.3 | 55 | 0.3 | 68 | 0.3 |
| Unemployed Worked before, seeking work | 1,805 | 4.2 | 851 | 4.4 | 967 | 4.1 |
| and available Seeking work for the first | 762 | 42.2 | 363 | 42.6 | 405 | 41.9 |
| time and available | 1,043 | 57.8 | 488 | 57.4 | 562 | 58.1 |
| Economically not active Did home duties (household chore) | 21,839 4,280 | 33.7 19.6 | 10,371 1,296 | 34.9 12.5 | 562 2,981 | 32.8 25.9 |
| Full time education | 11,640 | 53.3 | 6,534 | 63.0 | 5,122 | 44.5 |
| Pensioner/Retired | 415 | 1.9 | 311 | 3.0 | 104 | 0.9 |
| Disabled/Sick | 1,157 | 5.3 | 467 | 4.5 | 679 | 5.9 |
| Too old/young | 2,403 | 11.0 | 779 | 7.5 | 1,657 | 14.4 |
| Other | 1,944 | 8.9 | 984 | 9.5 | 955 | 8.3 |